
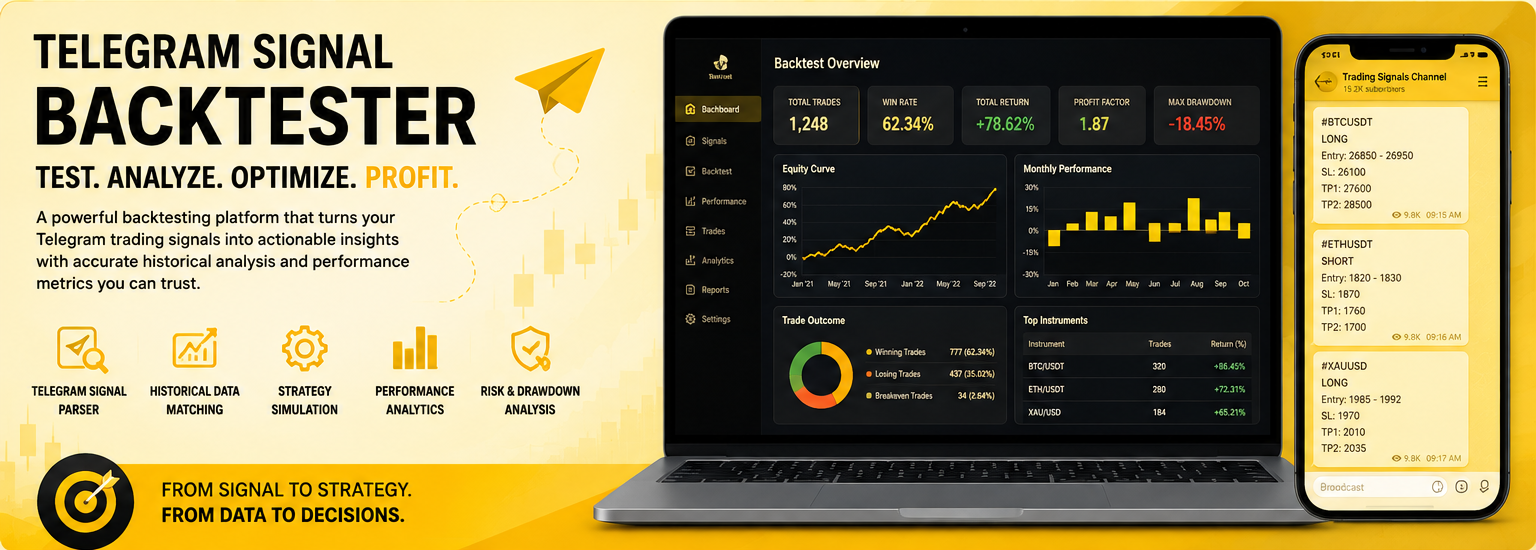
Case Study for CnEL India
Introduction
Financial markets generate a constant stream of trading information, including market signals, entry and exit suggestions, price levels, and strategy updates. Many traders receive these signals through messaging communities and use them to make decisions about financial instruments. However, receiving a signal and proving that a signal strategy is actually effective are two very different challenges.
A strategy may appear successful because of a few profitable trades, selective examples, or favorable market conditions. Without systematic historical testing, it is difficult to determine whether the strategy has genuine statistical value or whether its performance is simply the result of market randomness.
CnEL India can address this challenge by developing a dedicated signal backtesting system capable of collecting historical trading signals, interpreting their structure, matching them against historical market information, simulating trade outcomes, and generating detailed performance reports.
The objective is not simply to determine whether individual signals were profitable. A robust backtesting platform should evaluate the entire strategy under consistent and repeatable conditions. It should identify patterns, measure risk, account for timing and execution assumptions, and provide sufficient information for developers and analysts to understand why a strategy performed well or poorly.
This case study describes how CnEL India can approach the development of such a system, from signal collection and interpretation through algorithm design, historical simulation, performance analysis, optimization, and validation.
Business Background
Trading signals can contain information such as:
- Trading instrument
- Direction of the trade
- Entry price
- Stop-loss level
- Target price
- Signal timestamp
- Market conditions
- Additional instructions
- Updates or modifications
- Trade closure information
When hundreds or thousands of signals are distributed over time, manually reviewing them becomes extremely difficult.
A trader or analyst may want to answer questions such as:
- How many signals were profitable?
- What was the average return?
- Which instruments performed best?
- Which market conditions produced the strongest results?
- How frequently were stop-loss levels reached?
- How long did trades remain open?
- What was the maximum drawdown?
- Did performance change over time?
- How did different entry assumptions affect results?
- Were certain signal patterns consistently more successful?
A structured backtesting system can answer these questions systematically.
Project Objectives
The primary objective is to create a reliable historical testing environment for trading signals.
The system should be capable of:
- Collecting historical signal messages
- Extracting structured trade information
- Organizing signals chronologically
- Matching signals with historical market data
- Simulating trades according to defined rules
- Calculating profit and loss
- Measuring risk and performance
- Identifying strategy patterns
- Testing different assumptions
- Producing detailed reports
- Supporting algorithm optimization
- Providing reproducible results
The system should also make it possible to extend the testing framework later as new strategies or signal formats are introduced.
Signal Collection and Organization
The first stage involves gathering historical trading signals.
Messages may not always follow a perfectly consistent structure. One signal might explicitly mention an entry price and target, while another may use abbreviated terminology or provide updates in subsequent messages.
CnEL India would therefore design a structured processing workflow that converts raw messages into standardized records.
A signal record may contain:
- Signal identifier
- Date and time
- Instrument
- Trade direction
- Entry price
- Stop-loss
- Target
- Signal status
- Update history
- Closing information
- Associated market session
This structured representation becomes the foundation for the rest of the backtesting process.
Signal Parsing
One of the most important technical challenges is understanding the content of trading signals.
A signal may contain information in different formats.
For example, one message could communicate a long position with an entry range, while another may provide a specific entry price. Later messages might modify the target or close the position.
The system therefore needs a flexible parsing layer capable of identifying relevant fields while preserving the original timestamp and context.
The parser should also identify incomplete or ambiguous signals rather than automatically making assumptions.
This improves the reliability of the resulting dataset.
Signal Normalization
After extracting information, signals must be normalized into a common structure.
Normalization can standardize:
- Instrument names
- Buy and sell directions
- Price formats
- Date and time formats
- Target levels
- Stop-loss values
- Signal statuses
This allows signals from different periods or formats to be evaluated using the same testing framework.
Historical Market Data
A signal cannot be evaluated without corresponding historical market information.
The backtesting engine requires historical price information covering the relevant periods.
Depending on the strategy, this may include:
- Opening prices
- High prices
- Low prices
- Closing prices
- Trading volume
- Timestamps
- Market sessions
The required time resolution depends on the strategy.
A strategy based on short-term movements may require highly granular data, while a longer-term strategy may work with larger time intervals.
Matching Signals With Market Data
Once signals and historical market information are available, the system matches each signal with the appropriate market period.
This is important because a trade should only be evaluated using information that would have been available at the time the signal was generated.
The system must avoid accidentally using future market information when determining whether a trade was successful.
This principle, known as avoiding look-ahead bias, is essential for credible backtesting.
Trade Simulation
The core of the platform is the trade simulation engine.
When a historical signal is encountered, the engine creates a simulated position according to predefined rules.
For example, the simulation may determine:
- When the trade became active
- Which entry price was used
- Whether the entry was actually reached
- When the stop-loss was reached
- When the target was reached
- How long the position remained active
- What price was used for the exit
- What the resulting return was
The same rules are applied consistently across the complete historical dataset.
Entry Price Handling
Entry conditions can significantly influence backtesting results.
Some signals may specify:
- Exact entry prices
- Entry ranges
- Market entry
- Conditional entry levels
The system should allow different entry assumptions to be tested.
This helps determine whether the strategy remains effective under realistic execution conditions rather than only under ideal assumptions.
Stop-Loss and Target Analysis
Stop-loss and target levels are important components of many trading strategies.
The backtesting engine can evaluate whether the market reached either level after a signal became active.
The system must also account for situations where both levels could theoretically be reached during the same historical interval.
This requires carefully defined execution rules because the order in which price levels were reached may not always be known from coarse historical data.
Making these assumptions explicit is essential for producing credible results.
Profit and Loss Calculation
For each simulated trade, the system calculates the resulting outcome.
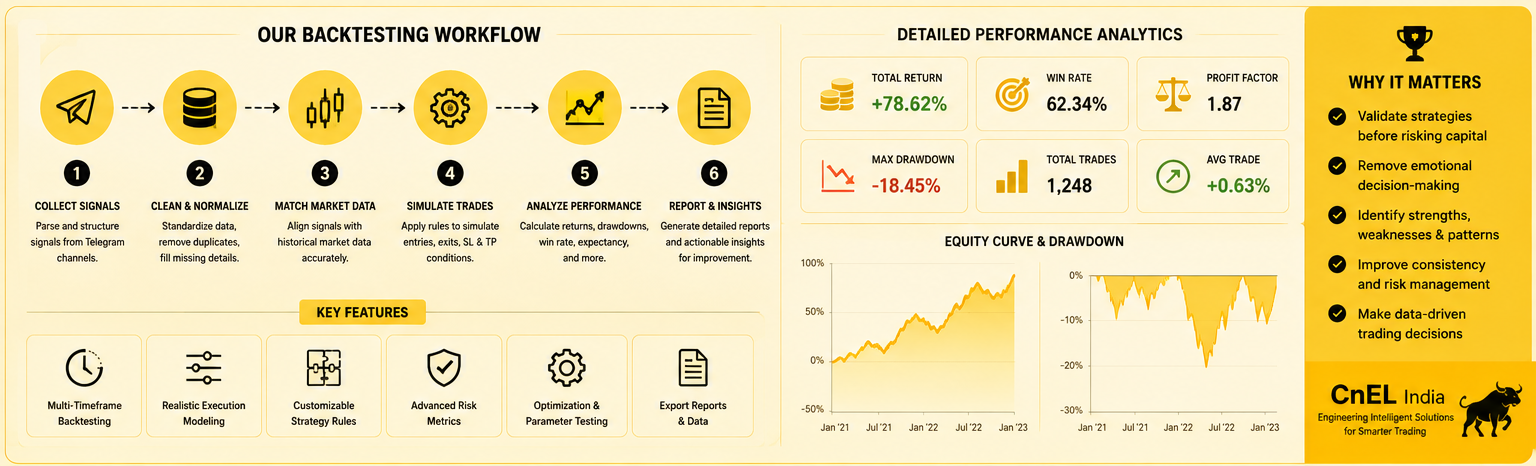
Performance measurements can include:
- Absolute profit or loss
- Percentage return
- Risk-to-reward ratio
- Winning trades
- Losing trades
- Break-even trades
- Average trade return
- Largest winning trade
- Largest losing trade
These metrics help analysts understand the strategy at both an individual-trade and portfolio level.
Risk Analysis
Profitability alone does not determine whether a strategy is useful.
A strategy can generate positive returns while experiencing significant periods of losses.
Therefore, the backtesting system should measure:
- Maximum drawdown
- Consecutive losses
- Volatility of returns
- Average risk per trade
- Worst-performing period
- Recovery duration
- Exposure
Risk measurements provide a more realistic understanding of strategy behavior.
Win Rate and Expectancy
Win rate is another useful metric.
However, a high win rate does not automatically mean that a strategy is strong.
For example, a strategy may have many small winning trades but occasionally experience very large losses.
CnEL India’s backtesting framework can therefore evaluate win rate alongside average profit, average loss, risk-to-reward characteristics, and overall expectancy.
This provides a more complete picture of strategy performance.
Drawdown Analysis
Maximum drawdown measures the decline from a previous performance peak to a subsequent low point.
This is particularly important because investors and traders need to understand how difficult it may be to continue following a strategy during a losing period.
The system can generate a historical equity curve and identify significant drawdown periods.
This helps analysts evaluate whether the strategy’s performance is stable or heavily dependent on a small number of successful trades.
Time-Based Analysis
Strategy performance can change over time.
CnEL India can include analysis by:
- Day
- Week
- Month
- Quarter
- Year
- Market session
This makes it possible to identify periods where the strategy performs particularly well or poorly.
Such analysis may reveal changes in market conditions, strategy effectiveness, or signal quality.
Instrument-Level Analysis
If signals cover multiple financial instruments, the system can evaluate each instrument separately.
For every instrument, the platform can calculate:
- Number of trades
- Win rate
- Average return
- Total return
- Drawdown
- Average holding period
- Risk characteristics
This allows analysts to determine whether the strategy’s results are broadly distributed or primarily driven by a small number of instruments.
Algorithm Development
The project also involves algorithm development to ensure that the backtesting engine follows clearly defined rules.
The algorithm needs to handle:
- Signal activation
- Entry conditions
- Exit conditions
- Stop-loss events
- Target events
- Position status
- Signal updates
- Duplicate signals
- Missing information
- Conflicting messages
The architecture should be modular so that additional strategies can be introduced without rewriting the entire system.
Reverse Engineering of Signal Logic
An important part of the project may involve understanding how signals are generated.
Historical signals can be analyzed to identify recurring characteristics.
For example:
- Frequently used entry patterns
- Typical target distances
- Common stop-loss ranges
- Time-based behavior
- Instrument preferences
- Signal frequency
- Repeated market conditions
The objective is not to assume that these patterns represent a valid strategy, but to identify hypotheses that can be tested objectively.
Optimization
Once a baseline backtest has been created, different strategy parameters can be evaluated.
Possible parameters include:
- Entry tolerance
- Stop-loss distance
- Target distance
- Holding period
- Trade filtering rules
- Position sizing assumptions
Optimization must be performed carefully.
Over-optimizing historical data can create a strategy that appears excellent in the past but performs poorly on new information.
Avoiding Overfitting
Overfitting is one of the major risks in strategy development.
A strategy may be adjusted repeatedly until it fits historical data extremely well.
However, this does not necessarily mean that the strategy has genuine predictive value.
CnEL India can reduce this risk by separating historical data into different periods for development and validation.
A strategy can first be evaluated on one historical period and then tested against another period that was not used during optimization.
Forward Validation
A robust backtesting workflow should include an out-of-sample validation process.
The system can reserve a portion of historical data that remains untouched during strategy development.
Once the strategy is finalized, it can be tested against this separate dataset.
If performance remains reasonably consistent, confidence in the strategy’s robustness increases.
Embedded and Systems-Level Engineering
The project also benefits from strong low-level programming and systems engineering knowledge.
A performance-oriented implementation may need to process large quantities of historical data efficiently.
Efficient memory handling, deterministic calculations, optimized loops, and careful resource management can become important when thousands or millions of market records are processed.
This is where CnEL India’s systems programming expertise can contribute to building a fast and reliable backtesting engine.
Physics and Quantitative Reasoning
The requirement for strong mathematical and physics-oriented thinking is relevant because market simulations involve numerical reasoning, time-series behavior, probability, and quantitative relationships.
A disciplined engineering approach can help ensure that:
- Calculations are deterministic
- Units are consistent
- Time intervals are handled correctly
- Numerical edge cases are considered
- Simulation assumptions are clearly documented
The objective is to produce a testing system whose results can be reproduced and independently verified.
Reporting Dashboard
The final system can provide a clear reporting interface for analysts.
Important sections may include:
Overall Performance
Total trades, returns, win rate, and drawdown.
Trade History
A complete list of simulated trades.
Strategy Analysis
Performance according to different strategy conditions.
Instrument Analysis
Performance by financial instrument.
Time Analysis
Performance across different periods.
Risk Analysis
Drawdown, losing streaks, and exposure.
This transforms raw backtesting results into actionable analytical information.
Data Quality and Validation
Data quality has a major effect on backtesting accuracy.
CnEL India can implement validation checks for:
- Missing market records
- Duplicate signals
- Incorrect timestamps
- Invalid prices
- Missing entry information
- Inconsistent signal updates
- Gaps in historical data
Problematic records can be flagged rather than silently included in calculations.
Testing and Quality Assurance
The backtesting engine itself requires extensive testing.
Unit tests can validate individual calculations.
Integration tests can verify the complete signal-to-result workflow.
Historical test cases can verify that known scenarios produce expected outcomes.
Edge cases can include:
- Signals with missing targets
- Multiple updates
- Simultaneous levels
- Duplicate messages
- Extremely short trades
- Large price gaps
- Market closures
- Incomplete data
This reduces the possibility of incorrect backtesting results.
Business Benefits
The completed system can provide several benefits:
- Automated historical signal evaluation
- Faster strategy analysis
- Consistent testing methodology
- Reduced manual calculations
- Detailed performance reporting
- Better understanding of strategy behavior
- Identification of strong and weak conditions
- Reproducible research
- Scalable testing infrastructure
Most importantly, it creates an objective framework for evaluating trading signals instead of relying only on anecdotal success stories.
Why CnEL India
CnEL India combines software engineering, algorithm development, data processing, systems programming, automation, and analytical application development.
For a project involving trading signal backtesting, this multidisciplinary approach is valuable because the solution requires more than basic data processing.
It requires careful handling of historical information, deterministic algorithms, numerical calculations, performance optimization, data validation, and clear reporting.
CnEL India can build the system around transparent rules so that every simulated trade can be traced back to its original signal and corresponding historical market conditions.
Conclusion
The Telegram Signal Backtester represents a practical application of software engineering and quantitative analysis to historical trading research.
Instead of manually reviewing large volumes of trading signals, the proposed system creates a structured environment where signals can be collected, normalized, matched with historical market data, simulated under defined rules, and evaluated using consistent performance and risk metrics.
The platform can also support deeper analysis through instrument-level reporting, time-based evaluation, optimization, validation, and strategy research.
A key strength of the proposed approach is its emphasis on transparency. Every assumption involved in entry, exit, stop-loss, target execution, and market-data interpretation should be documented and testable.
For CnEL India, this project demonstrates the ability to combine low-level programming expertise, algorithmic thinking, data processing, quantitative reasoning, and application development into a specialized financial technology solution.
The final outcome is not simply a report showing how many trades won or lost. It is a reusable backtesting framework that enables teams to investigate trading strategies systematically, identify strengths and weaknesses, validate hypotheses against historical information, and establish a foundation for future quantitative research.
While historical performance can never guarantee future market results, a carefully engineered backtesting system provides a much stronger basis for evaluating a strategy than manual observation or isolated examples. By emphasizing accuracy, reproducibility, risk analysis, and independent validation, CnEL India can deliver a robust platform for structured trading signal research.